Sample work

Evidence you can click through.

A selection of working dashboards built on public and simulated data. Each one answers a real business question, and you can open it and try it yourself.

Dashboards open in a new tab. If one has been idle, it may take up to 30 seconds to wake up.

Area 01

Finance

Risk, valuation, forecasting and market signals, built from public financial data.

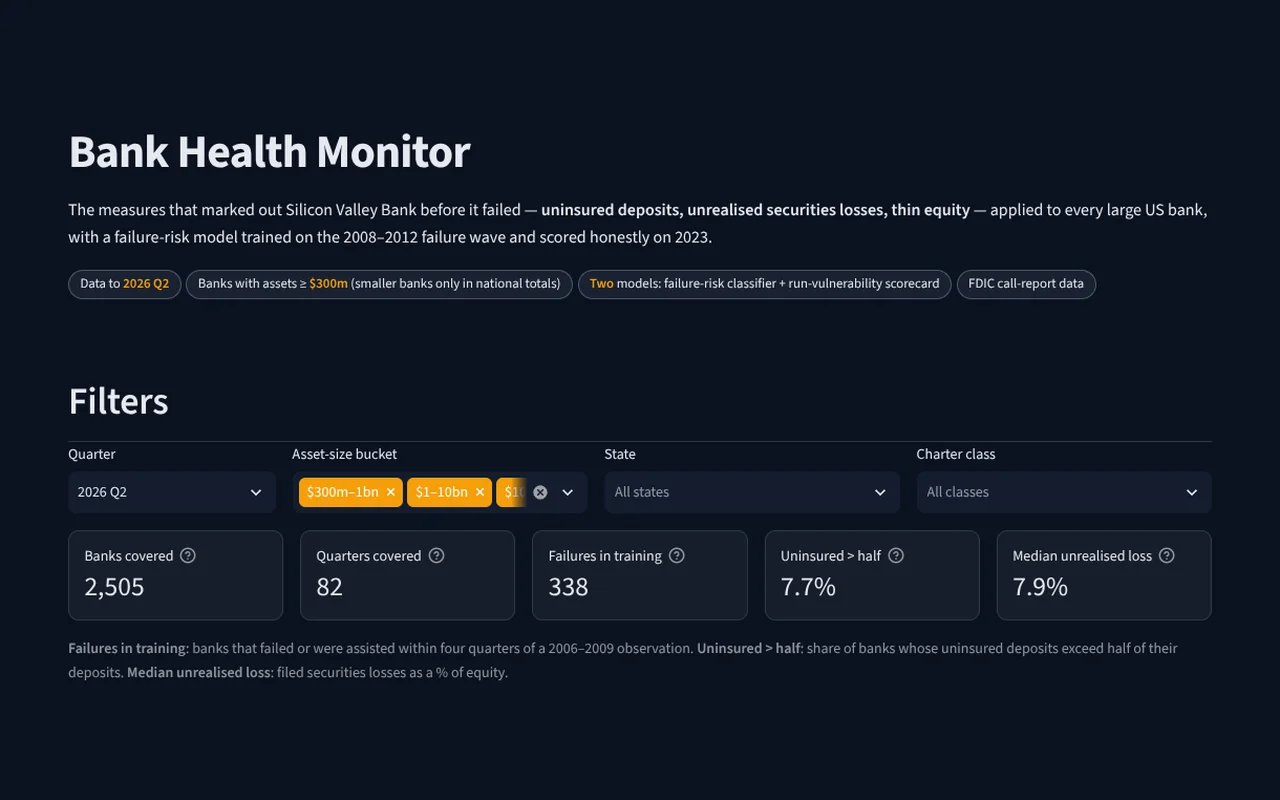
Screenshot of the Bank health monitor dashboard

Bank health monitor LIVE

The warning signs behind Silicon Valley Bank’s collapse, applied to every large US bank.

Rank banks on run vulnerability, see how a failure-risk model scored the 2023 failures, and drill into any bank’s filings.

Open the live dashboard ↗
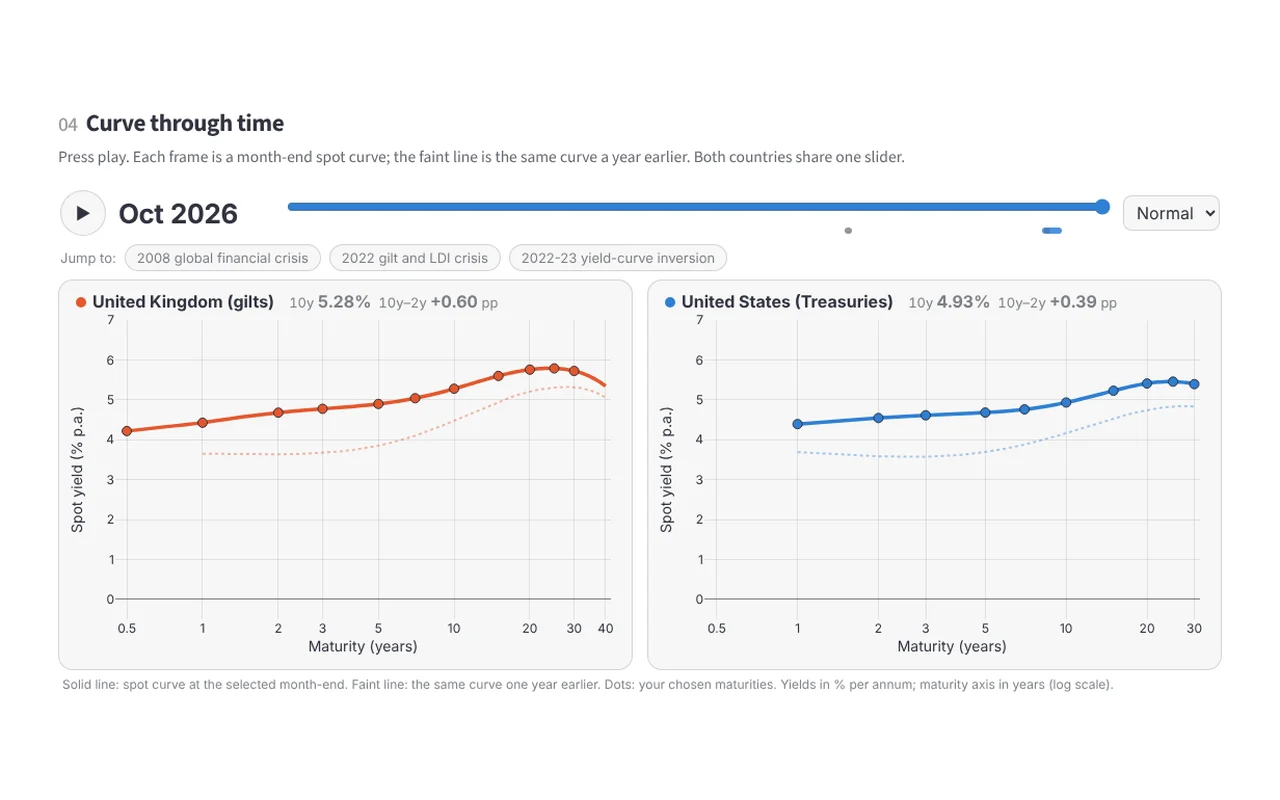
Screenshot of the Yield curve forecasting dashboard

Yield curve forecasting LIVE

UK and US government yield curves, fitted month by month and forecast ahead.

Watch four decades of curves move, compare forecasts with what happened, and see how a curve shift changes a bond’s price.

Open the live dashboard ↗
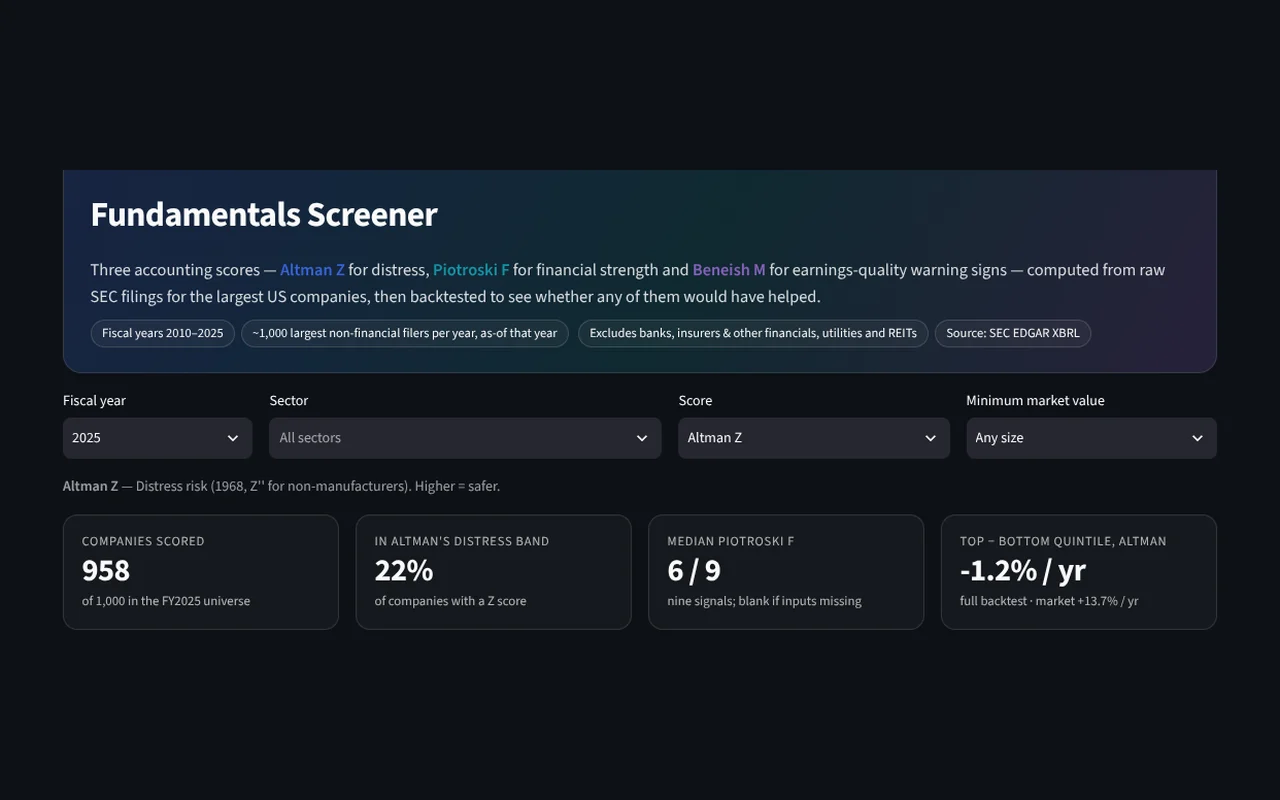
Screenshot of the Fundamentals screener dashboard

Fundamentals screener LIVE

Three classic accounting scores, computed from raw SEC filings for the largest US companies.

Screen and sort companies, see the line items behind any score, and check whether each score would have paid off.

Open the live dashboard ↗
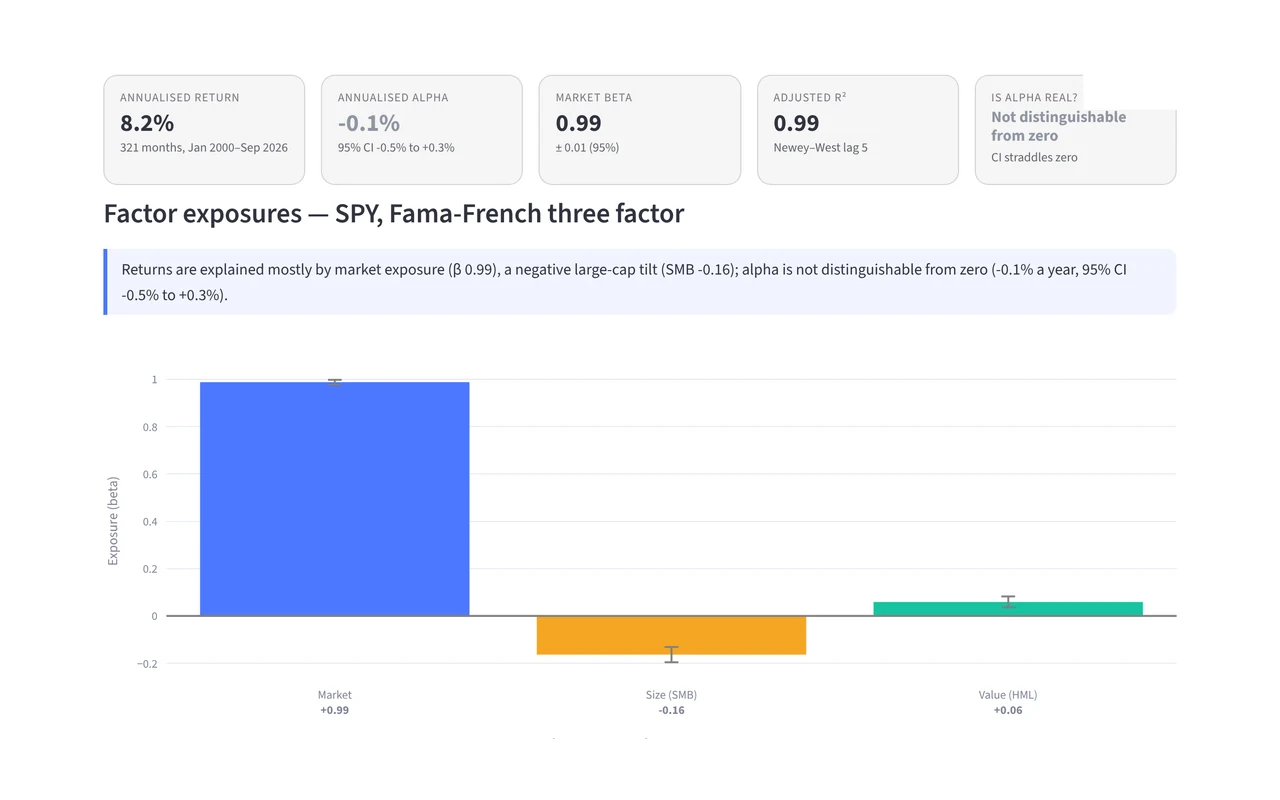
Screenshot of the Factor X-ray dashboard

Factor X-ray LIVE

What is actually driving a fund’s returns?

Break dozens of US funds into market, size, value, profitability, investment and momentum exposures, see what is left once those are accounted for, and watch each fund’s style drift over the decades.

Open the live dashboard ↗
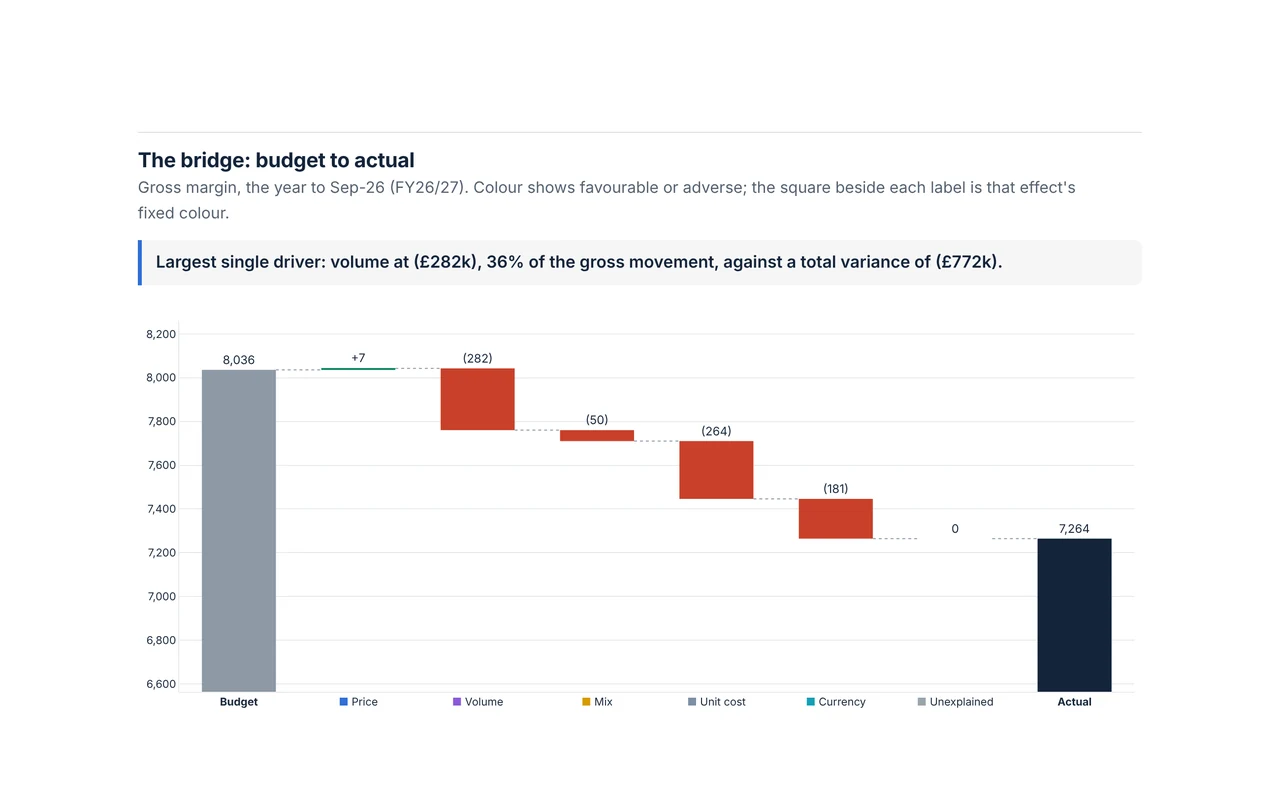
Screenshot of the FP&A variance room dashboard

FP&A variance room LIVE

We missed the budget, but why?

Split the gap for a fictional company into price, volume, mix, cost and currency effects that reconcile exactly, forecast the rest of the year from its drivers, and test what a price or cost move would do.

Open the live dashboard ↗
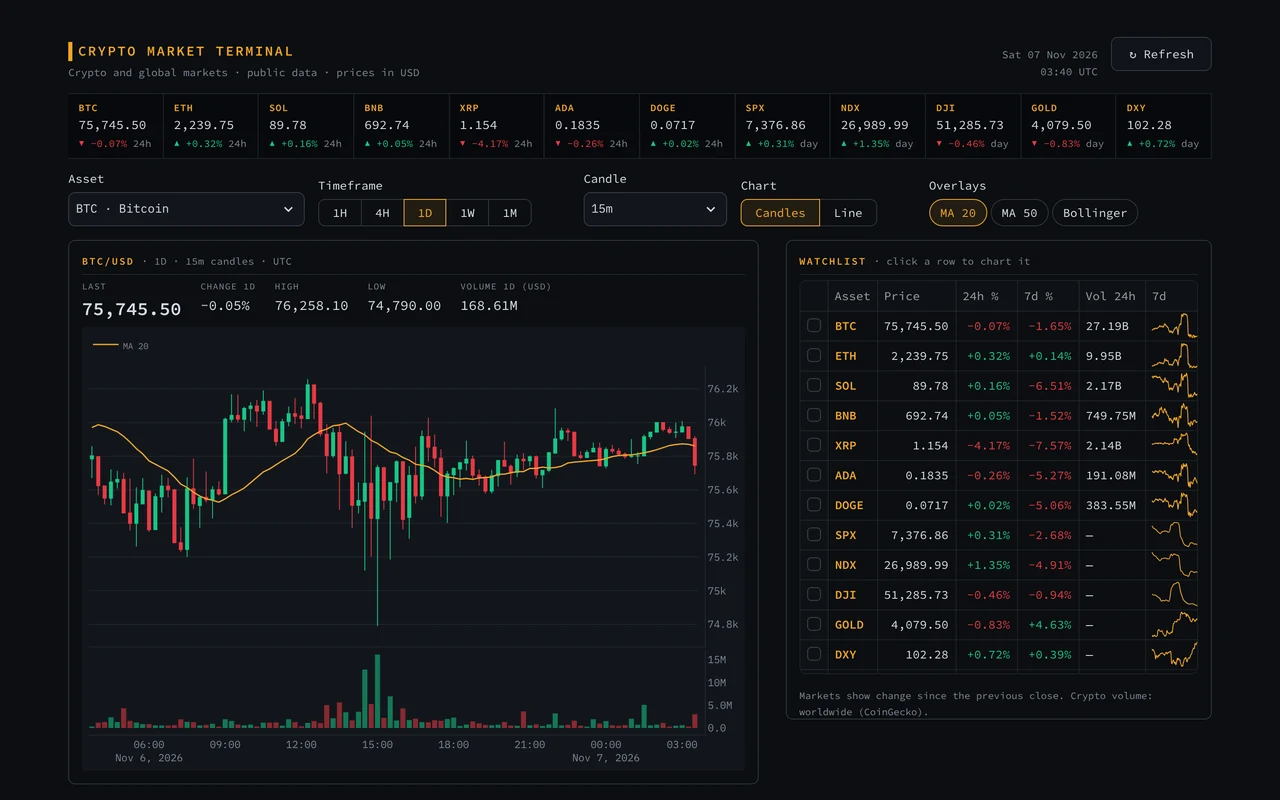
Screenshot of the Crypto market terminal dashboard

Crypto market terminal LIVE

A Bloomberg-style terminal for crypto and global markets, built on free public data.

Click a coin in the watchlist to chart it with candlesticks, volume, moving averages and Bollinger Bands, then compare trends and see the day’s top movers.

Open the live dashboard ↗
Area 02

Operations

Scheduling, staffing, queues and routes: the right people and resources in the right place.

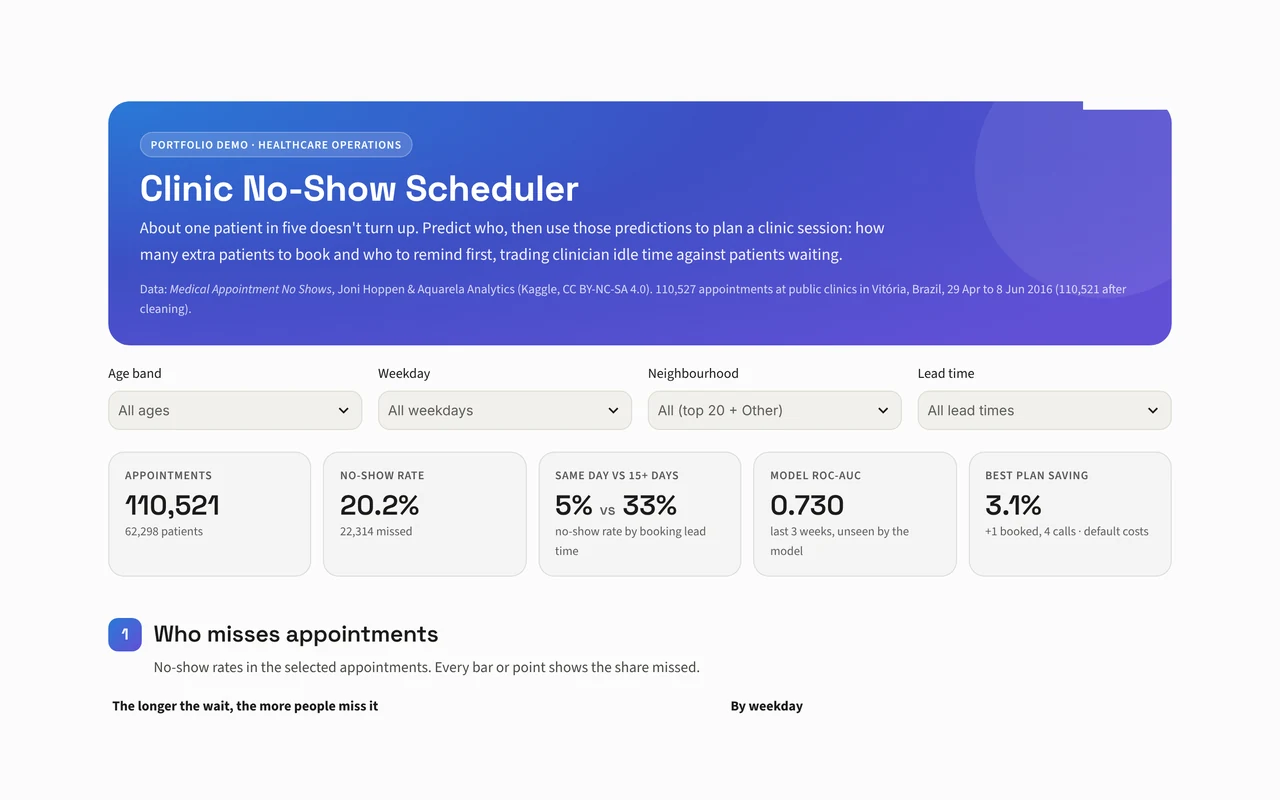
Screenshot of the Clinic no-show scheduler dashboard

Clinic no-show scheduler LIVE

Which patients won’t turn up, and what should a clinic do about it?

Predict no-shows, then simulate a clinic session to find the overbooking and reminder plan that balances idle time against waiting.

Open the live dashboard ↗
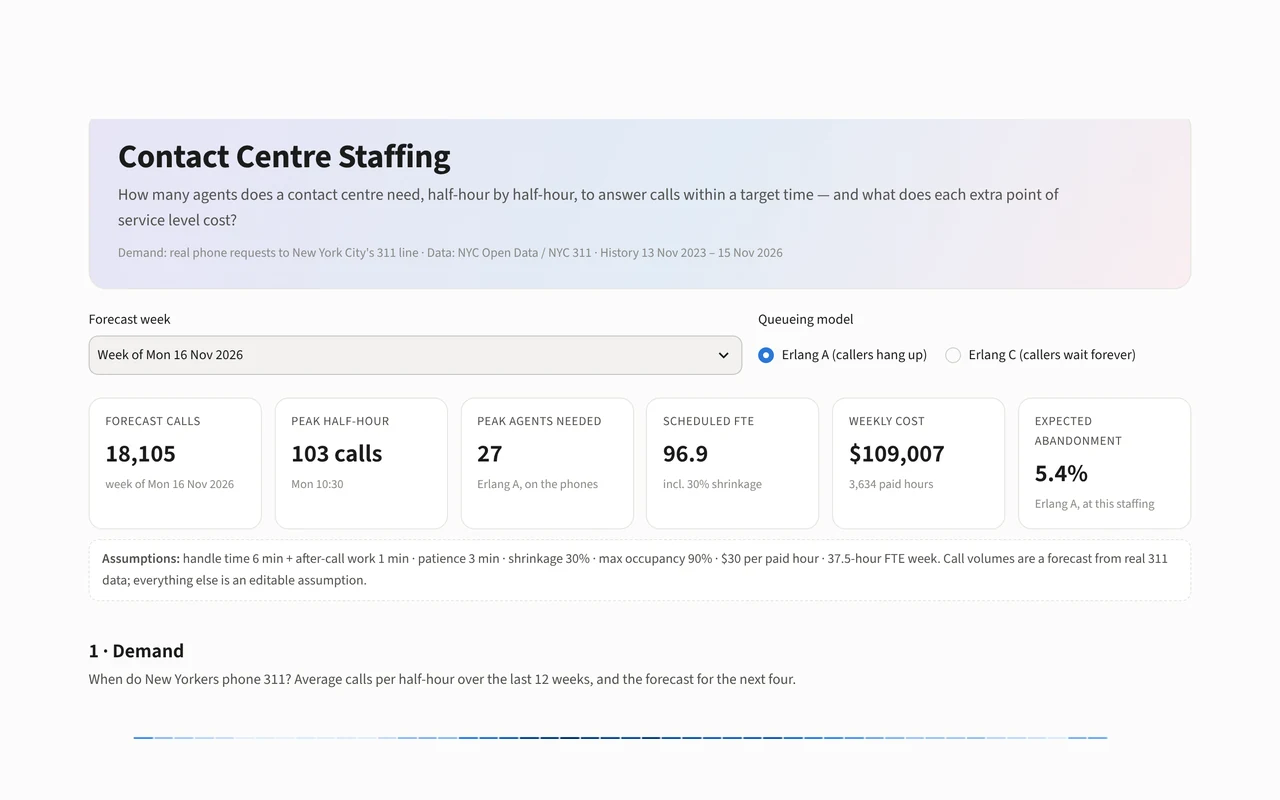
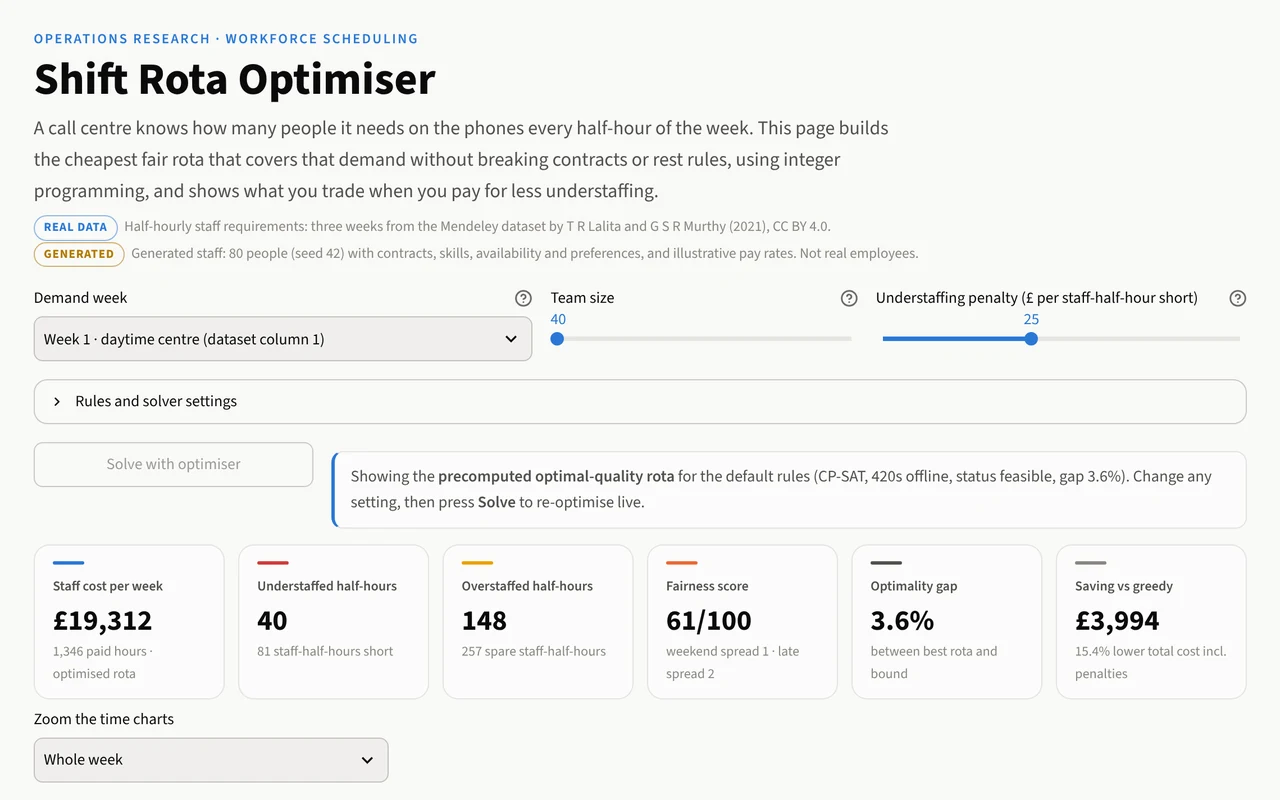
Screenshot of the Contact centre staffing dashboard

Contact centre staffing LIVE

How many agents does a contact centre need every half-hour?

Forecast real call volumes, turn them into a staffing curve with queueing theory, and see what each extra point of service level costs.

Open the live dashboard ↗
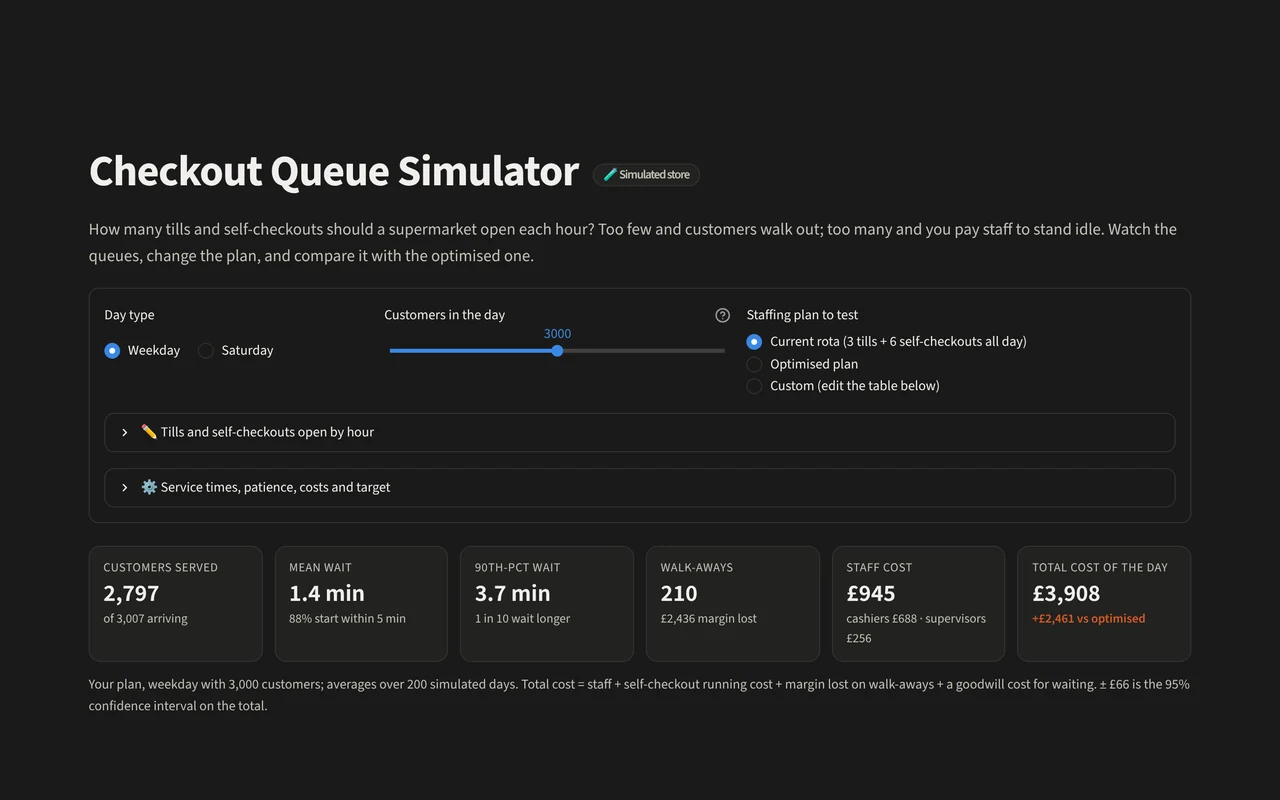
Screenshot of the Checkout queue simulator dashboard

Checkout queue simulator LIVE

How many tills should a supermarket open?

Watch a simulated store’s queues build through the day, change the staffing, and find the plan that balances staff cost against customers walking away.

Open the live dashboard ↗
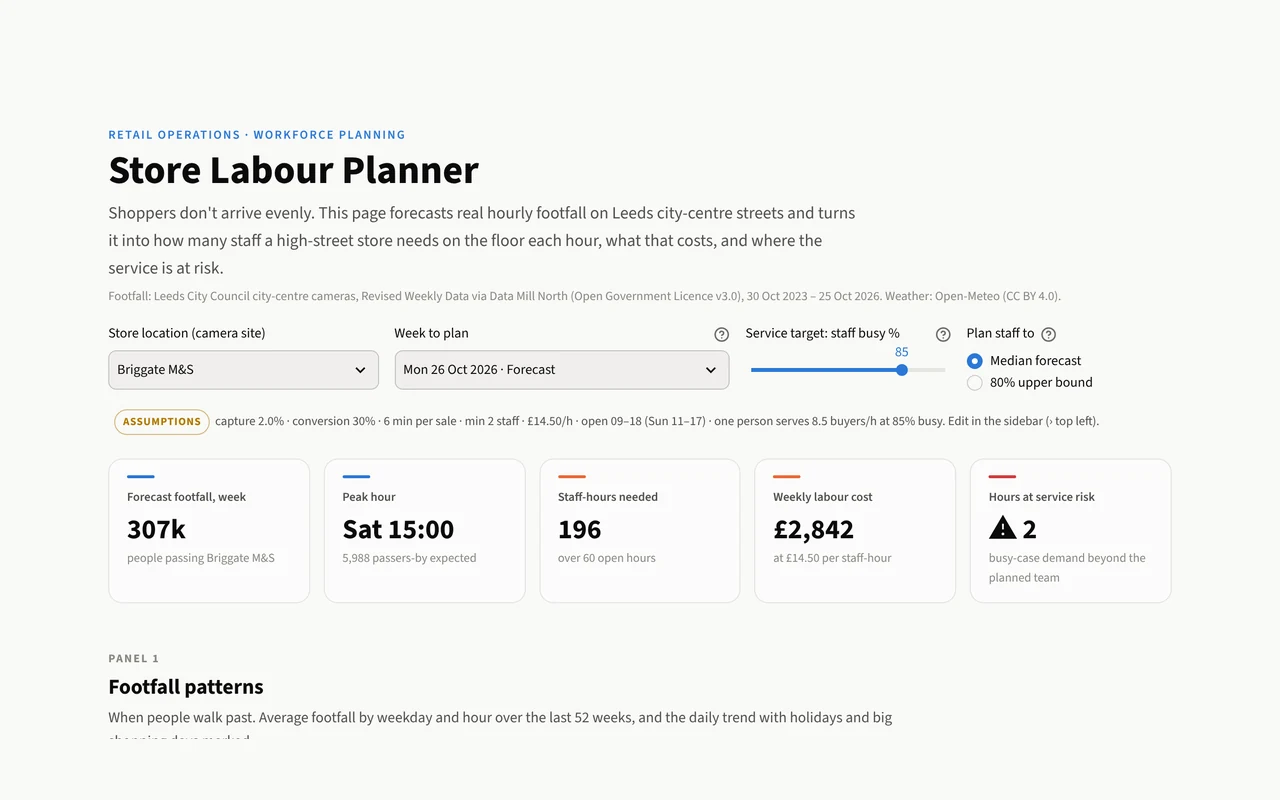
Screenshot of the Store labour planner dashboard

Store labour planner LIVE

How many staff should a high-street shop have on the floor each hour?

Forecast real city-centre footfall, turn it into an hour-by-hour staffing plan, and see the cost of covering the peaks.

Open the live dashboard ↗
Area 03

Digital marketing

Which channels, customers and campaigns actually earn their budget.

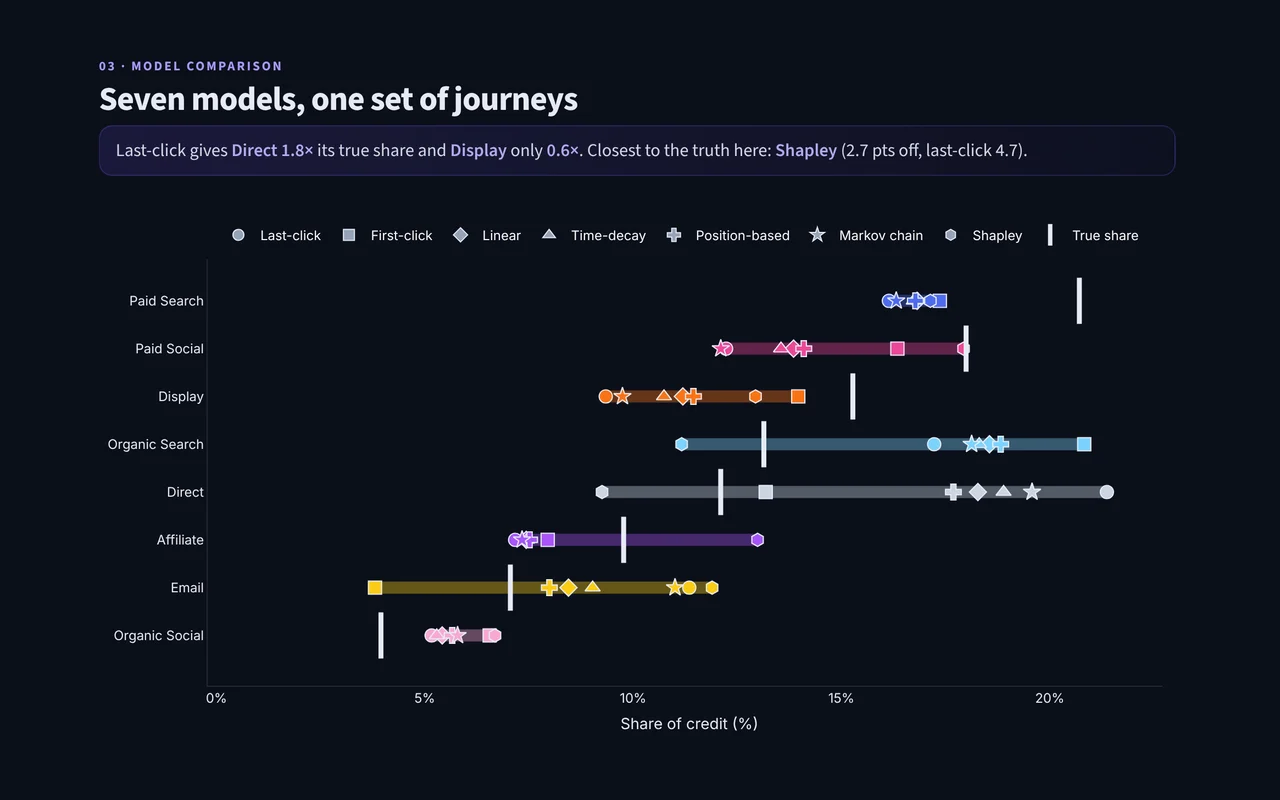
Screenshot of the Attribution Lab dashboard

Attribution Lab LIVE

Same conversions, seven attribution models: which channels really earned the sale?

Score each model against a simulated ground truth and see how much budget moves depending on the model you pick.

Open the live dashboard ↗
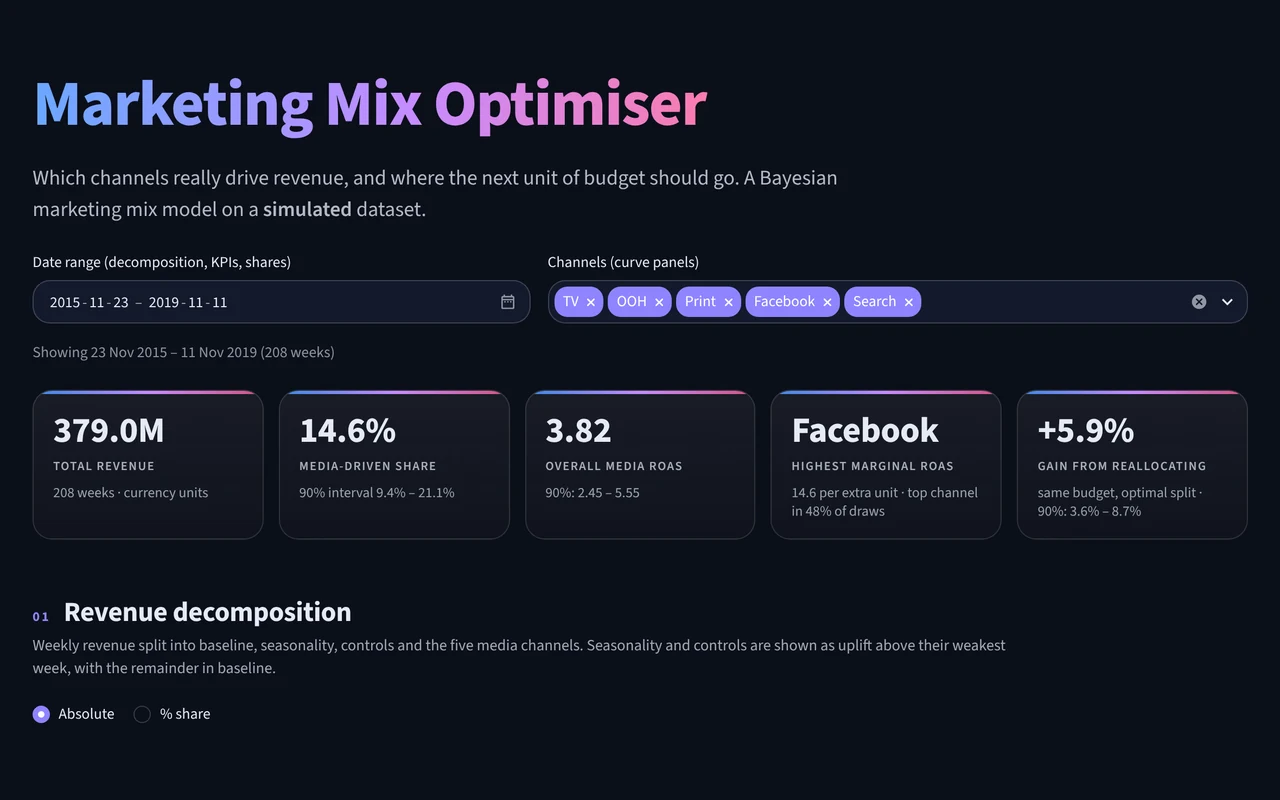
Screenshot of the Marketing mix optimiser dashboard

Marketing mix optimiser LIVE

How much revenue each channel really drives, and where more spend stops paying, from a Bayesian model on simulated data.

Compare spend with contribution, read each channel’s saturation curve and test a new budget split.

Open the live dashboard ↗
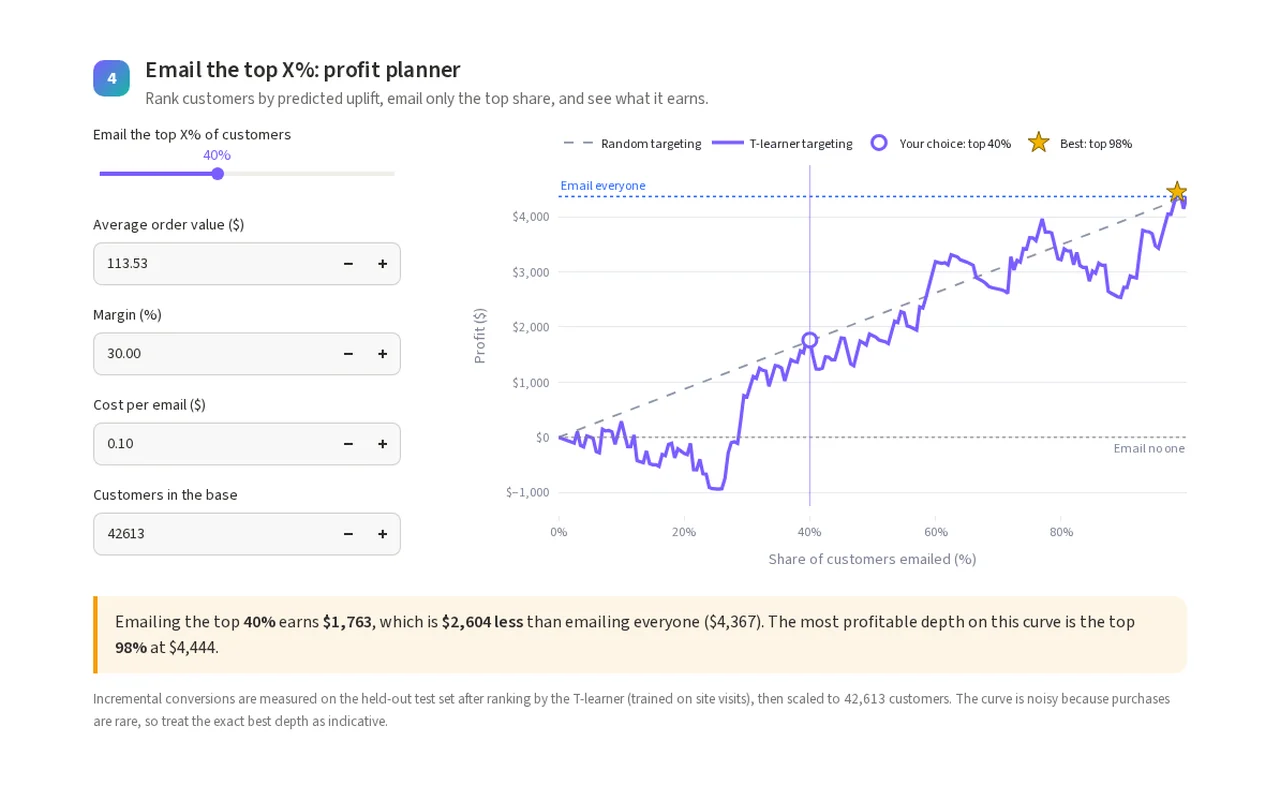
Screenshot of the Uplift targeting dashboard

Uplift targeting LIVE

Which customers does a marketing email actually persuade?

Compare two uplift models on a real randomised email test and choose how many customers to target for the most profit.

Open the live dashboard ↗
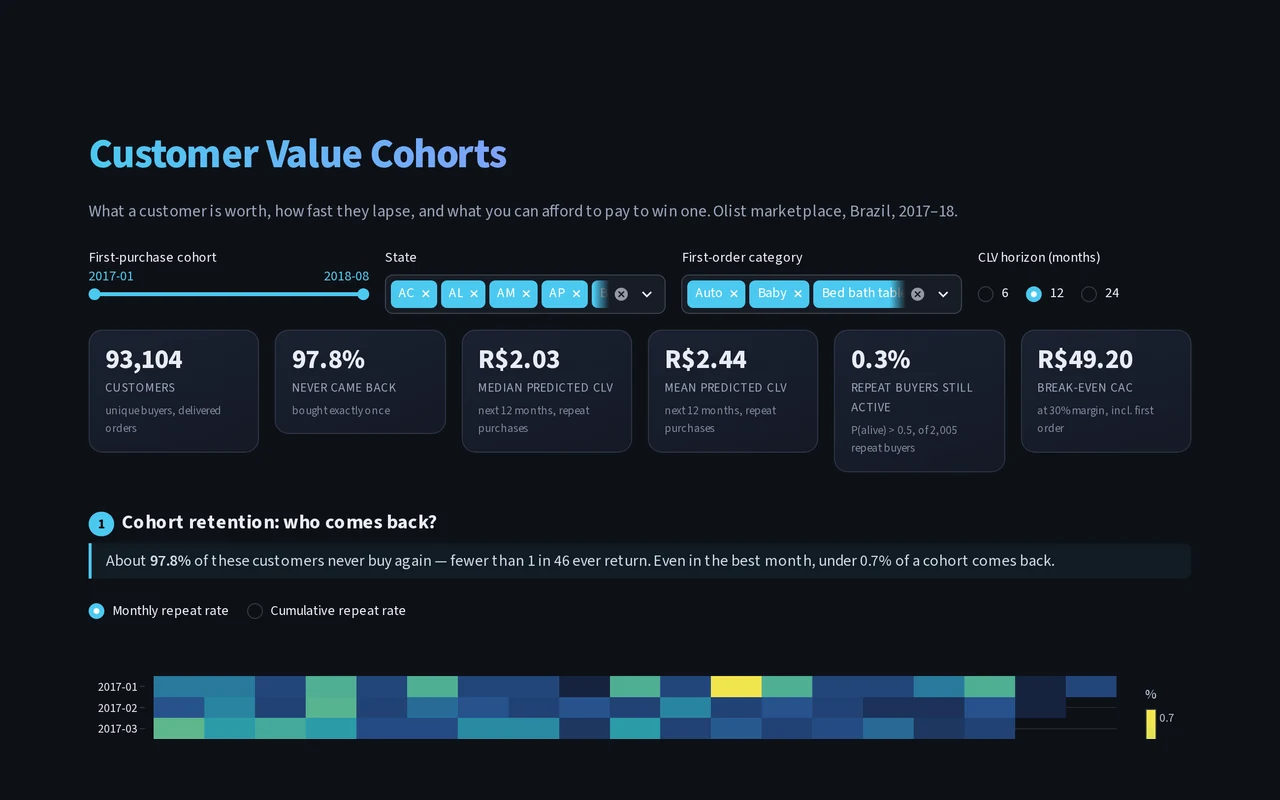
Screenshot of the Customer value cohorts dashboard

Customer value cohorts LIVE

What is a customer worth, and how much can you afford to pay to win one?

Explore retention cohorts, predicted lifetime value and customer segments for a real online marketplace, and test acquisition costs against the payback point.

Open the live dashboard ↗
Area 04

Sales and retail

Demand, pipeline, baskets and stock: what will sell, and what to hold.

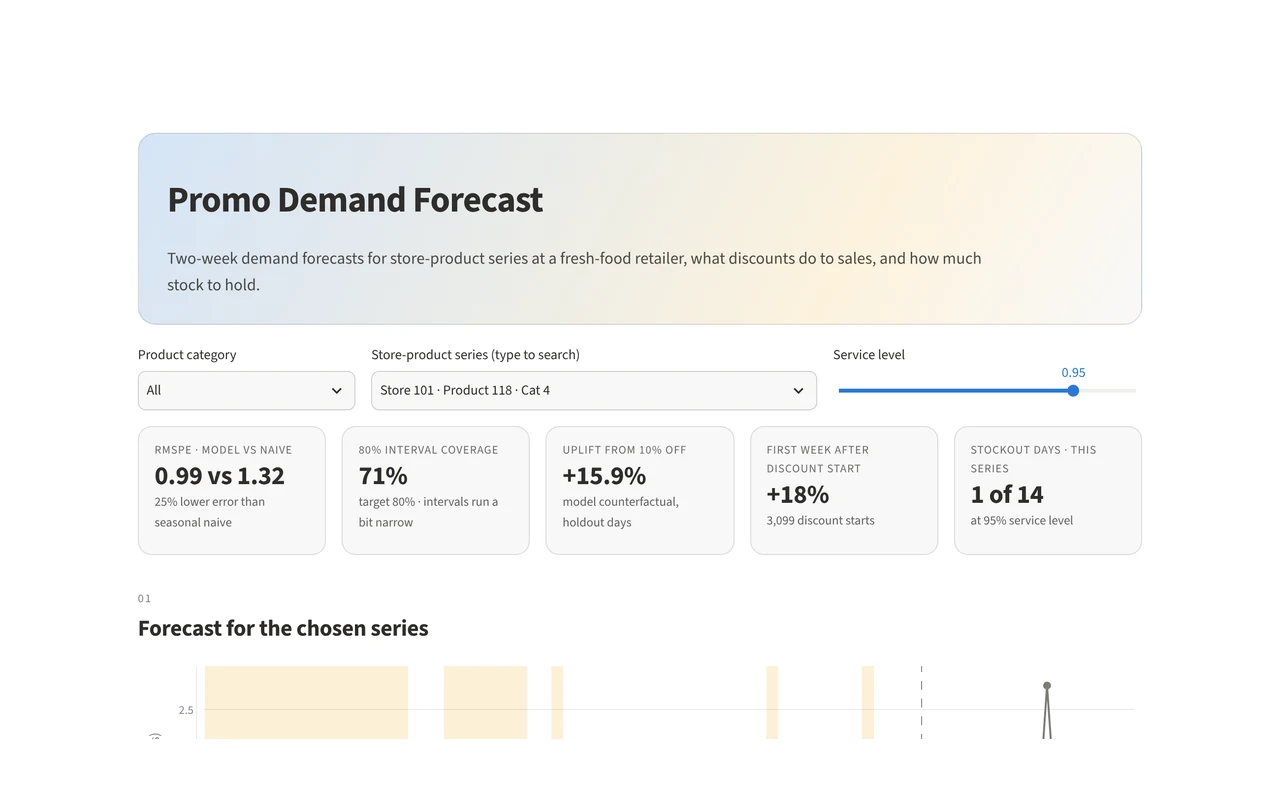
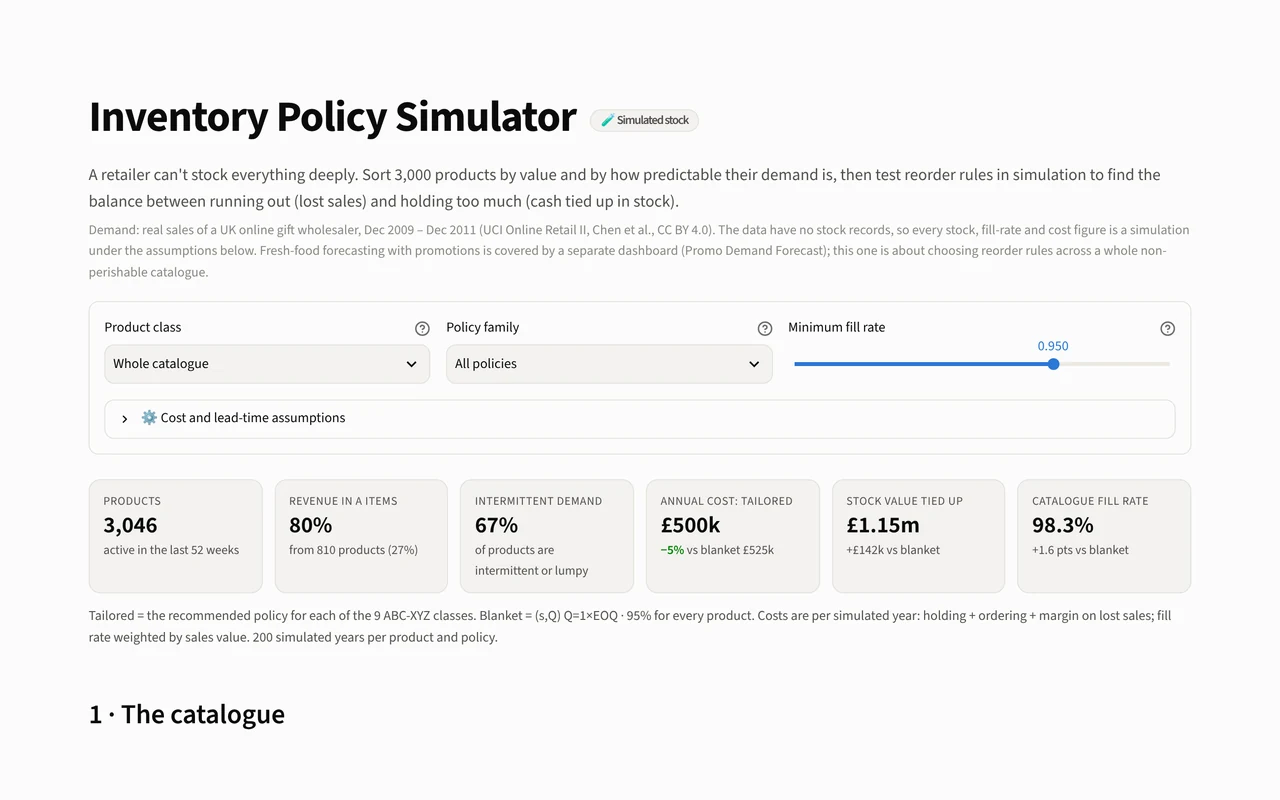
Screenshot of the Promo demand forecast dashboard

Promo demand forecast LIVE

How much will each product sell over the next two weeks, and how much stock should a fresh-food retailer hold?

Explore probabilistic forecasts, see what discounts do to sales, and set a service level to find the cheapest stock policy.

Open the live dashboard ↗
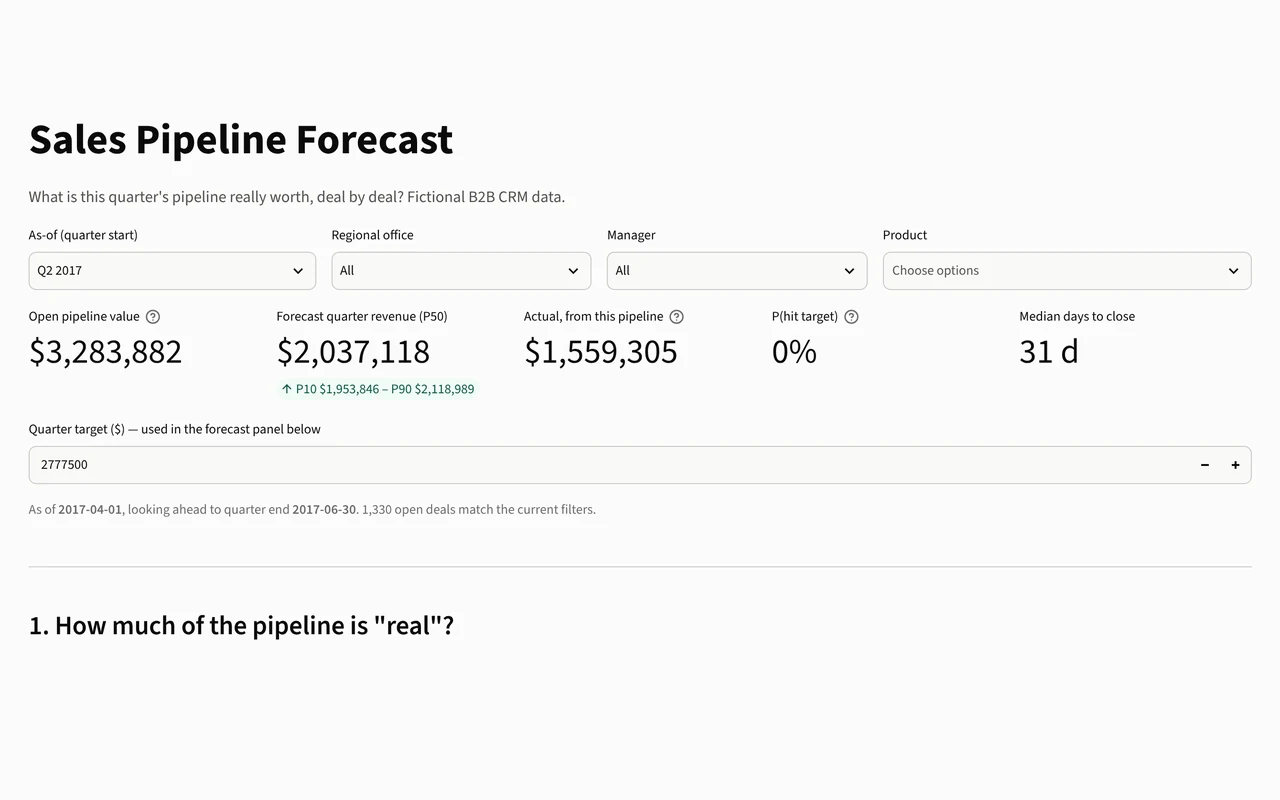
Screenshot of the Sales pipeline forecast dashboard

Sales pipeline forecast LIVE

What is this quarter’s sales pipeline really worth?

Rewind to any quarter start, see each deal’s chance of closing in time, simulate quarter-end revenue against what actually happened, and compare agents fairly.

Open the live dashboard ↗
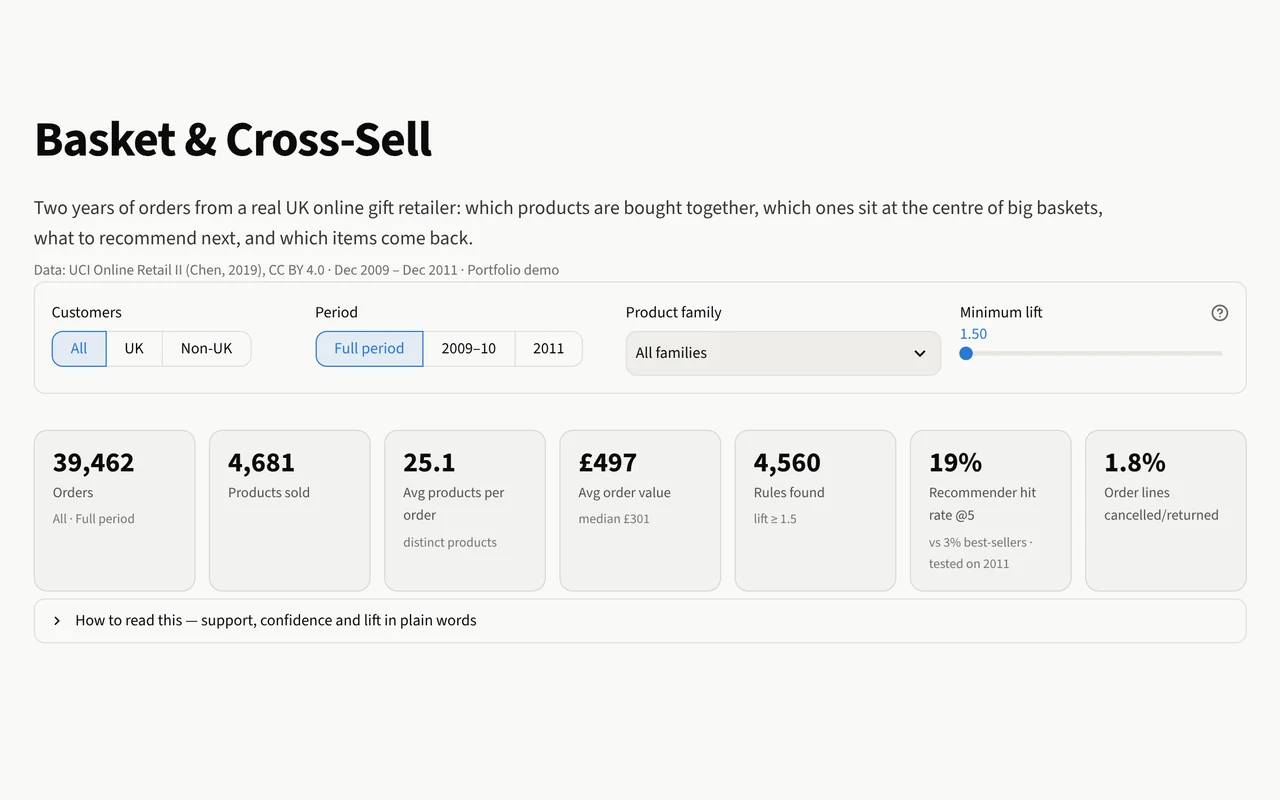
Screenshot of the Basket and cross-sell dashboard

Basket and cross-sell LIVE

Which products sell together?

Explore two years of a UK online retailer’s orders to find product pairs and families, get cross-sell recommendations, and spot the items most often returned.

Open the live dashboard ↗
Area 05

HR and people

Pay, headcount, rotas and absence: the workforce questions behind every plan.

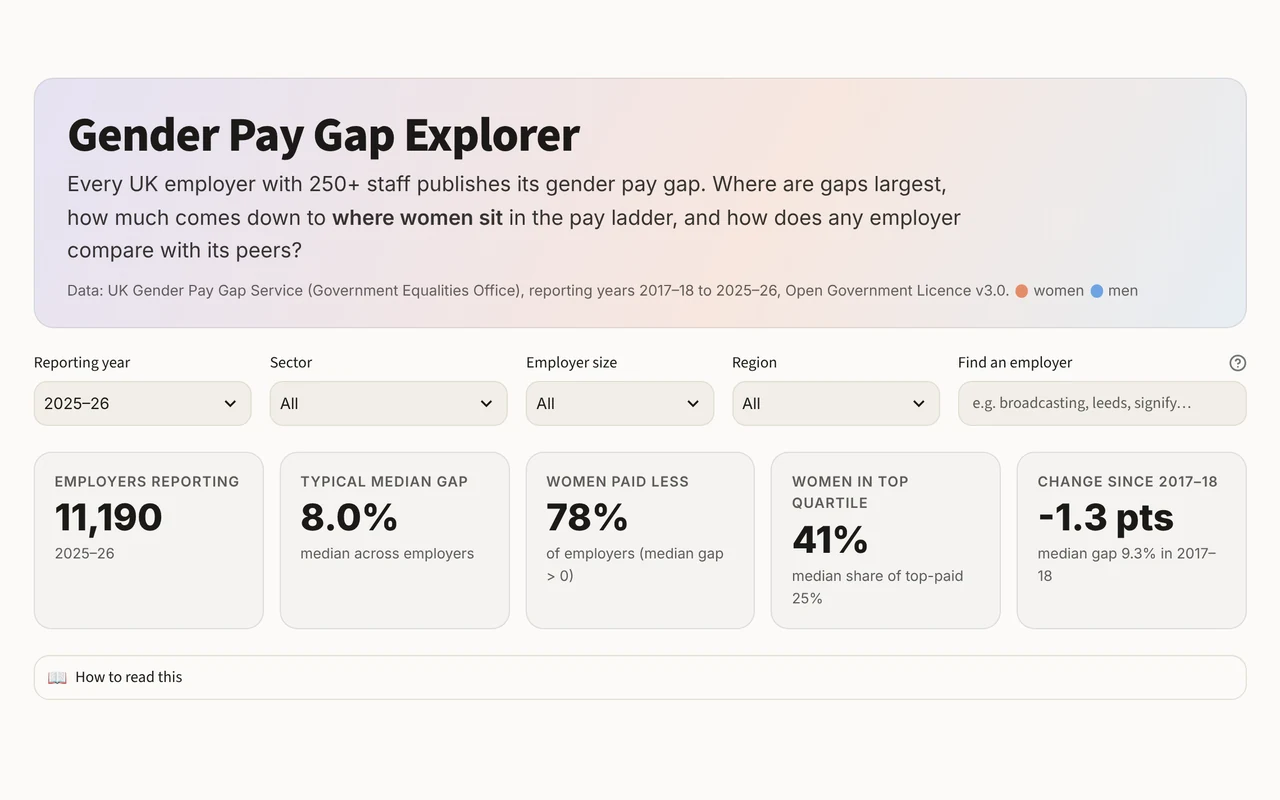
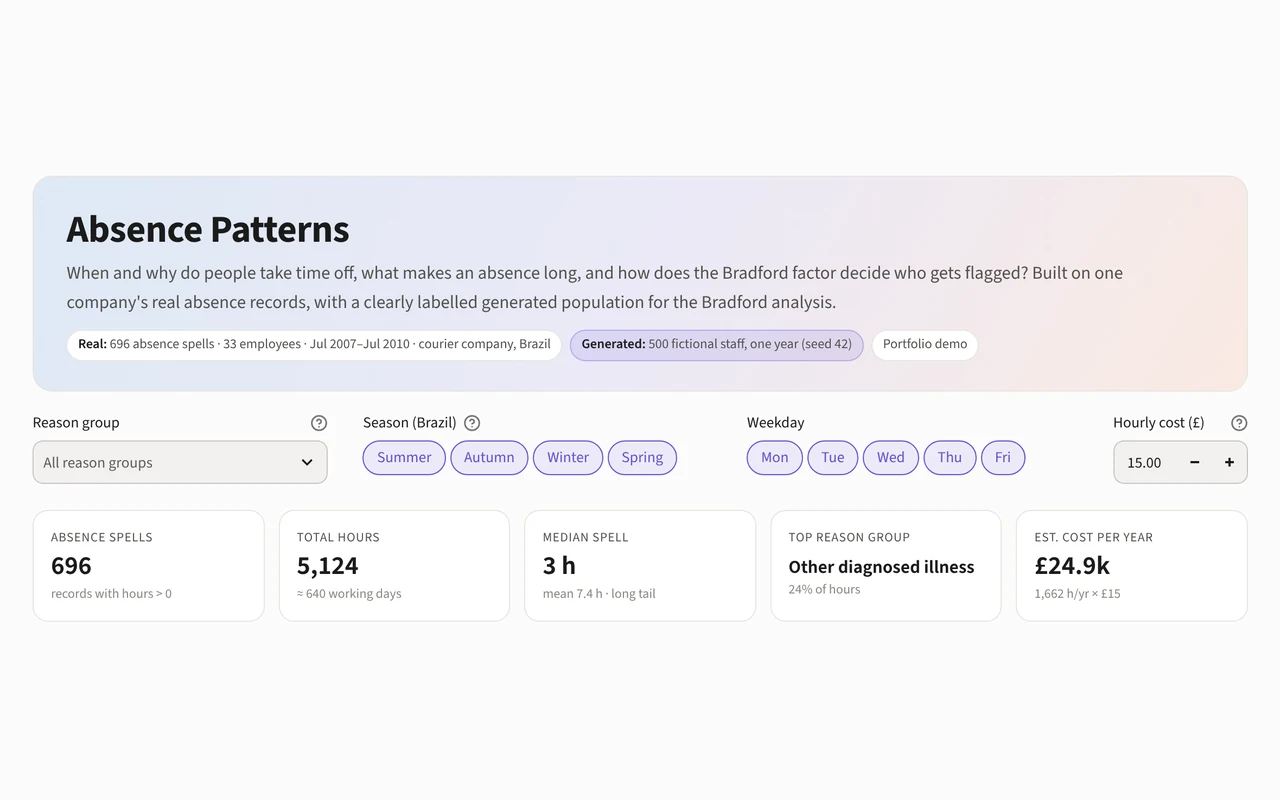
Screenshot of the Gender pay gap explorer dashboard

Gender pay gap explorer LIVE

How big is the gender pay gap at UK employers, and why?

Explore every large employer’s figures, see how much comes down to where women sit in the pay ladder, and benchmark any employer against its peers.

Open the live dashboard ↗
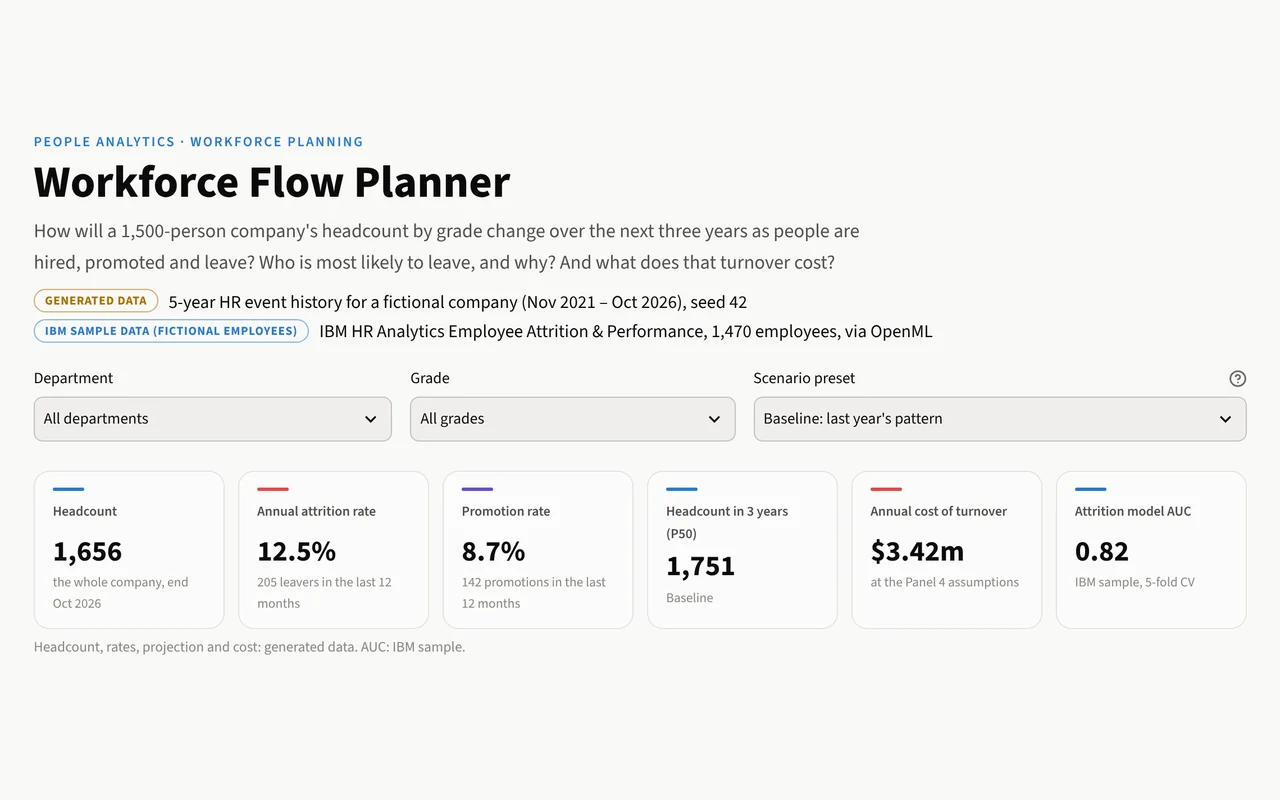
Screenshot of the Workforce flow planner dashboard

Workforce flow planner LIVE

How will a company’s workforce change over the next three years?

Follow hires, promotions and leavers through the grades, test hiring and retention scenarios, and see who is most likely to leave and what turnover costs.

Open the live dashboard ↗
Area 06

IT service management and CRM

Incidents, changes, tickets and accounts: keeping services and customer relationships healthy.

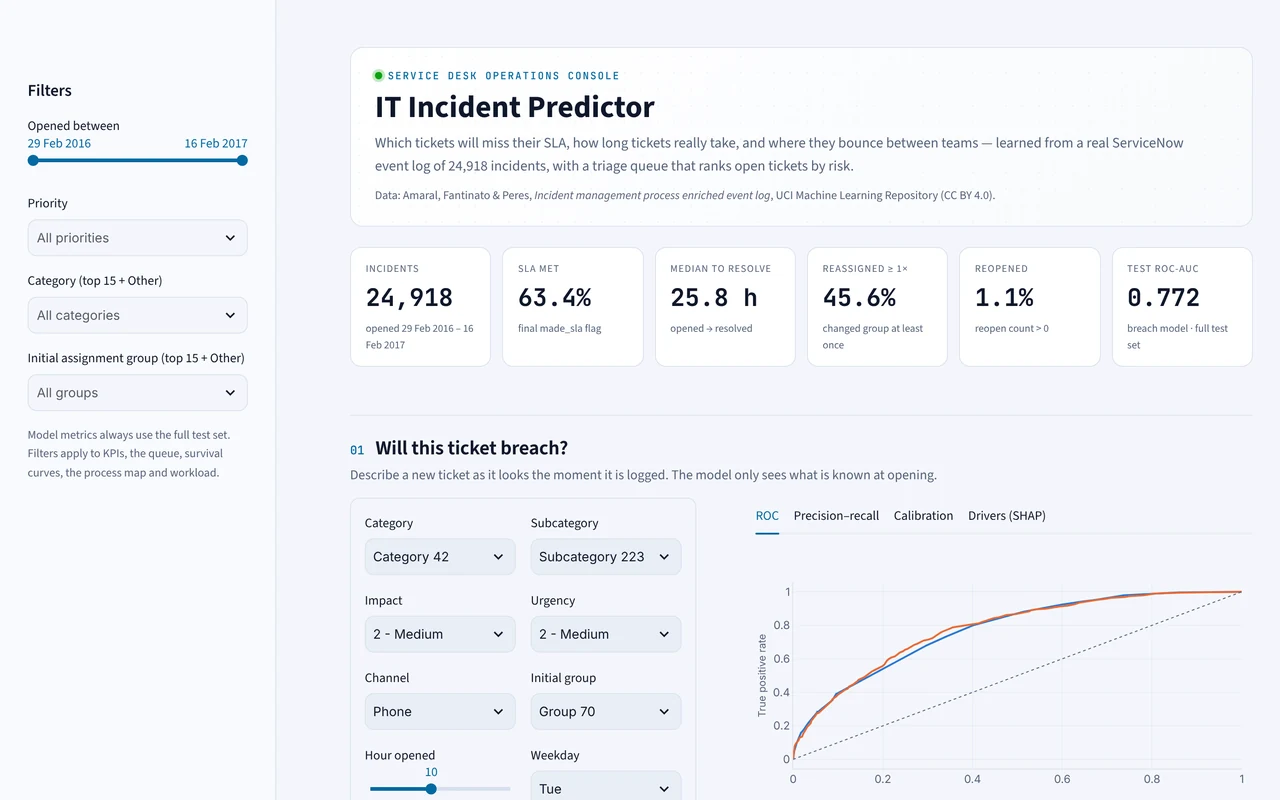
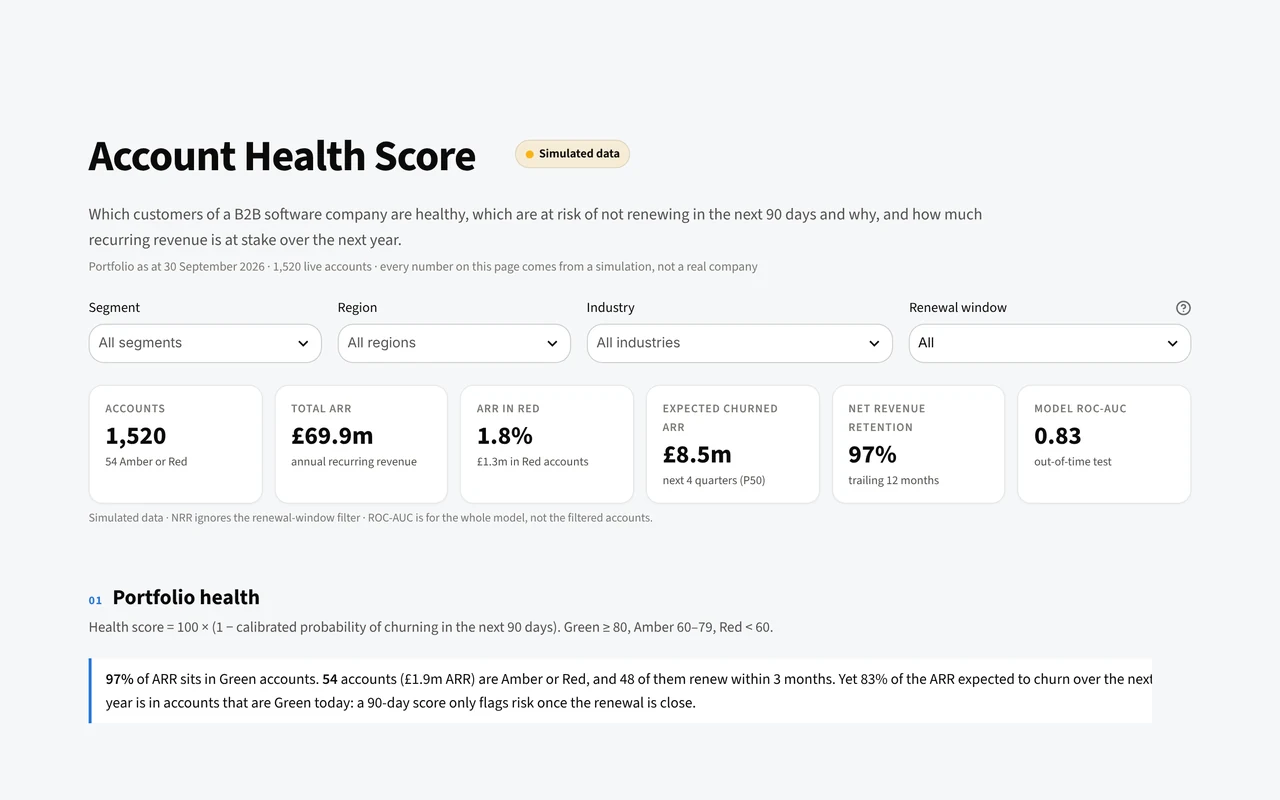
Screenshot of the IT incident predictor dashboard

IT incident predictor LIVE

Which IT tickets will miss their SLA?

A model trained on a real ServiceNow log flags risky tickets the moment they open, ranks the live queue, and maps where tickets bounce between teams.

Open the live dashboard ↗
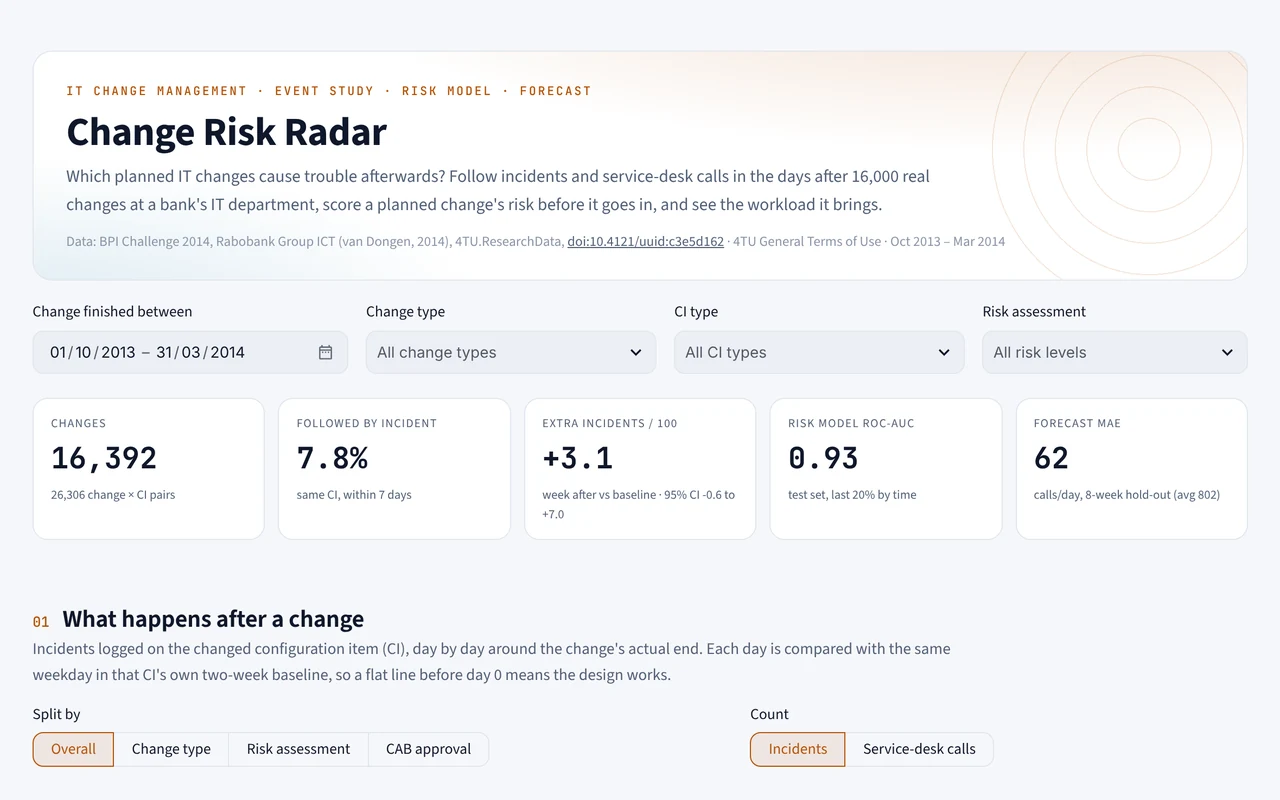
Screenshot of the Change risk radar dashboard

Change risk radar LIVE

Which IT changes cause trouble?

See how incidents and service-desk calls jump after a change, score a planned change’s risk before it goes live, and forecast the workload it will bring.

Open the live dashboard ↗
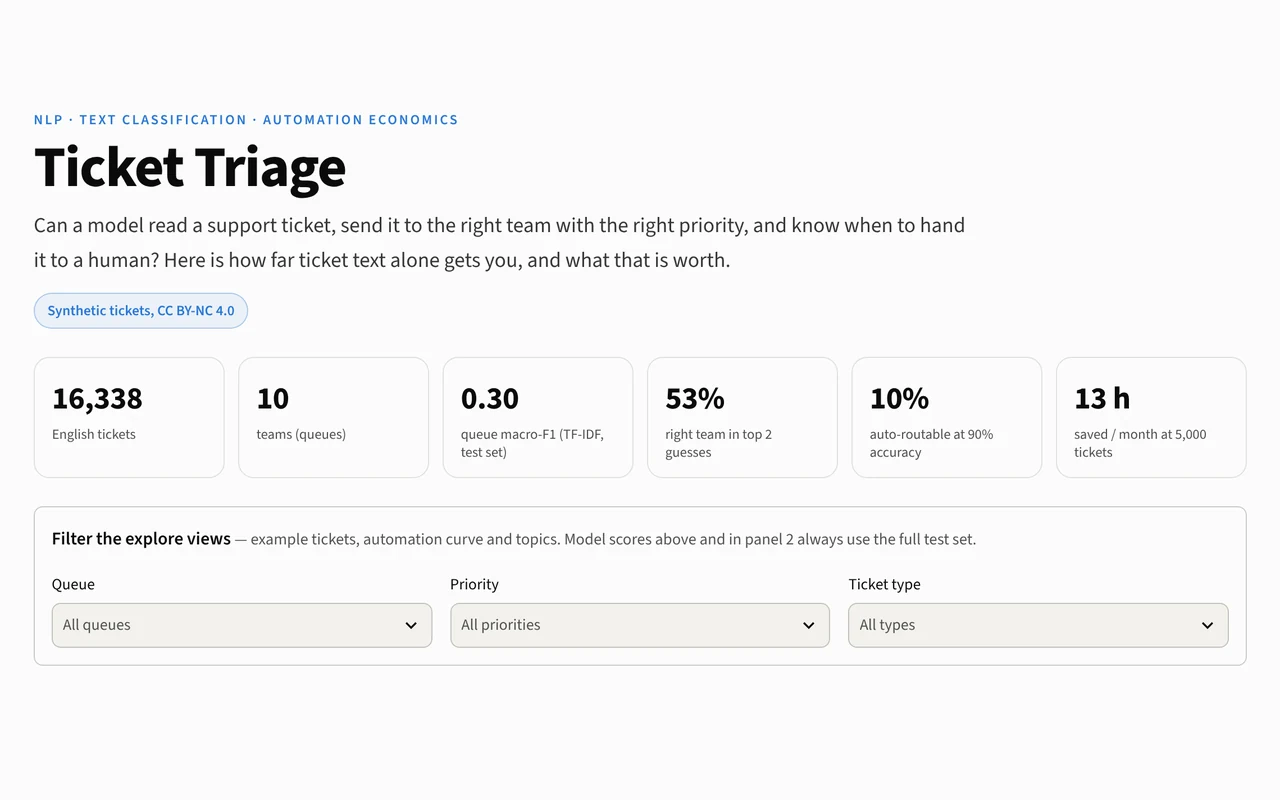
Screenshot of the Ticket triage dashboard

Ticket triage LIVE

Can a model read a support ticket and route it?

Type a ticket and watch it pick the team and priority, see where it gets confused, and set how much triage to automate.

Open the live dashboard ↗

Want something like this for your data?

Tell us the decision you need to make. We'll tell you honestly what the data can and can't answer.

contact@innditech.com →